Search


Information
ICMST-Tohoku 2018
Oct. 23 - 26, 2018
Sendai, Japan
ICMST-Shenzhen 2016
Nov 1 - 4, 2016
Shenzhen, China
(EXIT THIS PAGE)
ICMST-Kobe 2014
Nov 2(Sun) - 5(Wed), 2014
Kobe, Japan
Nuclear Regulation Authority Outline of the New Safety Standards for Light Water Reactors for Electric Power Generation
For Public Comment
Outline of New Safety Standard (Design Basis)
For Public Comment
New Safety Standards (SA) Outline (Draft)
For Public Comment
Outline of New Safety Standard(Earthquake and Tsunami)(DRAFT)
Issues
 

Vol.10 No.2(Aug)
Vol.10 No.1(May)
Vol.9 No.4(Feb)
Vol.9 No.3(Nov)

< Other Issues


Occasional Topics
OTjapan Measures for Tsunami Striking Nuclear Power Station in Japan
Special Article: The Great Tohoku Earthquake (1)
OTjapan The Tragedy of “To Be” Principle in the Japanese Nuclear Industry
EJAMOT_CN3_Figure1_The_outside_view_of_CEFR OTChinaPlanning and Consideration on SFR R&D Activities in China
< All Occasional Topics

Featured Articles
EJAM7-3NT72 A New Mechanical Condition-based Maintenance Technology Using Instrumented Indentation Technique
EJAM7-3NT73 Survey robots for Fukushima Daiichi Nuclear Power Plant

JSM
Contacts
(EJAM): ejam@jsm.or.jp
(JSM): secretariat@jsm.or.jp
HP: http://www.jsm.or.jp
(in English)

 
Vol.2 No.1 previous GA 13 - AA 15 - SP2 (16 - 17 - 18 ) - NT 23 - 24 - 25 next Vol.2 No.3
Vol.2, No.2, NT25 EJAM(2-2-NT25) Visualization Method of UT Wave Propagation Phenomena for assisting the Better Understanding of Inspection Results

Visualization Method of UT Wave Propagation Phenomena for Assisting the Better Understanding of Inspection Results

 
Nondestructive Evaluation Center
Japan Power Engineering and Inspection Corporation (JAPEIC)
 

KEYWORDS:
UT Inspection, Wave Propagation, Visualization, Photoelastic Method, Observation in Cross Section, Probe Characteristics, Sound Field, Material Inhomogeneity and Anisotropy

 
1. Technical summary
 
Classification
(I: Inspection, II: Repair, III: Replacement, IV: Preventive Maintenance, V: Others)
 

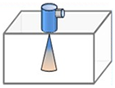
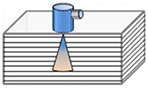
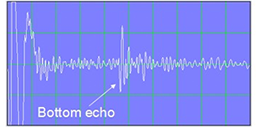
Ultrasonic testing(UT) is one of the most important and useful NDE(Nondestructive Examination) technique for detecting the defects and ensuring the reliability of structural components. UT has the distinctive aspect that can examine the inner portion of the plate, similarly to radiographic testing(RT).

On the other hand, UT requires the sufficient experience and skillful technique for the evaluation of inspection results. Because the received waveform contains many signals such as direct reflection, the multiple path reflections from defects, reflections from geometrical discontinuities, and the materials interface between welding, buttering and base metals.

Then, if the propagation of UT wave can be seen, it is very helpful for better understanding of the origin of indications.

JAPEIC has developed three techniques which can visualize the UT wave propagation path, that is to say where UT beam goes to and from where UT beam comes back. First is the photoelastic method[1], 2nd is the direct UT wave observation in the cross section of the materials[2], and 3rd is the movie which obtained from the results of computer simulation[3],[4]. Here, 1st one and 2nd one are explained.

Figure 1 shows the setup of photoelastic method for the observation of UT wave propagation in the glass specimen. Special glass is used as the objective materials of UT, because that glass has the photoelastic property and same UT wave velocity as the steel. UT wave, i.e. stress wave, can be seen under the polarized light.

Figure 2 explains how to obtain the direct visualization result in the cross section of the inspected materials itself. The probe for the inspection is put on the surface where is adjacent to cross section. Then small aperture pick-up probe is scanned on the hole area of cross sectional plane. The collected UT waveform on each scanned position is analyzed and constructed to the wave propagation image or the movie.

 
EJAM2-2NT25-Fig.1_Schematic_diagram_of_UT_wave_visualization_by_photoelastic_method

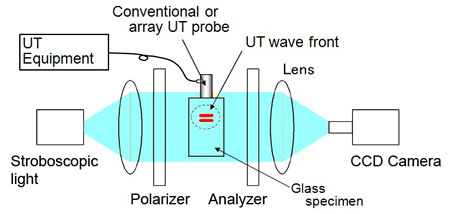
Fig.1 Schematic diagram of UT wave visualization by photoelastic method

EJAM2-2NT25-Fig.2_Principle_for_visualization_of_UT_wave_propagation

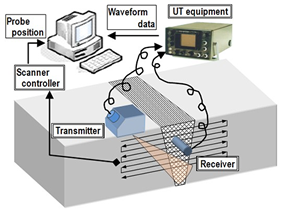
Fig.2 Principle for visualization of UT wave propagation
in the cross section of materials

2. Scope

Photoelastic visualization method can be used for following objectives;

(1) Confirmation of the beam profile for the probe design.
(2) Evaluation of the inspection results (A-scan waveform ) which were obtained from the complicated components.
(3) Optimization of the inspection conditions or the parameters in many kind of special inspections.

Direct visualization method can be used for following objectives;

(4) Understanding of UT beam propagation, beam spreading, and beam dispersion characteristics in the inhomogeneous and/or anisotropic materials such as welding, buttering, and cast stainless steel.
(5) Estimation and evaluation of real inspection results, such as the amplitude and the SN ratio of A-scan waveform.
 
3. Features
  • Figure 3 shows the typical feature of photoelastic visualization method. UT beam profile of the focus probe can be observed in figure 3(a), and some fundamental phenomena, such as UT beam reflection at the surface of side drill hole, mode conversion to the surface wave around the hole, and initiation of delayed echo caused by this surface wave, can be seen in figure 3(b).

このページのコンテンツには、Adobe Flash Player の最新バージョンが必要です。

Adobe Flash Player を取得

このページのコンテンツには、Adobe Flash Player の最新バージョンが必要です。

Adobe Flash Player を取得

(a) UT beam profile of focus probe (b) UT wave reflection, diffraction, and mode conversion behaviour around the hole
 
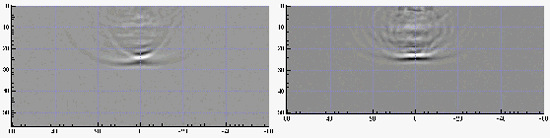
Fig. 3 Typical feature of photoelastic visualization method
  • Figure 4 shows the feature of the direct visualization method. UT beam which has propagated through inconel weld has skewed, dispersed, and remained the scattered reflections behind the wave front, in contrast to the wave in the base metals which propagates straight and smooth.

このページのコンテンツには、Adobe Flash Player の最新バージョンが必要です。

Adobe Flash Player を取得


(a) In the base metal


(b) In the Inconel weld


Fig. 4 Direct visualization of the UT wave propagation in material cross section

4. Examples of Application
  • One of the application of photoelastic visualization is shown in figure 5. In this case, the coverage of sound field that is produced by phased array technique has been evaluated in order to support the improvement of code and standard for the inspection.
  • In JSME Code named “Rules on Fitness-for-Service for Nuclear Power Plants, the requirement for the inspection of class 1 components of nuclear power plant has been discussed to reduce the inspection volume from the full thickness to 1/3 thickness of inner portion as shown in figure 5(a)[5]. This reduction of inspection volume would cause the remarkable improvement of UT inspection period, because only the circumferential movement of phased array sector scanning operation on few axial position would be required in order to cover the reduced inspection volume.
  • It is verified as shown in figure 5(b) that the longitudinal sector scanned beam of phased array can cover the reduced inspection volume.
  • Figure 6 shows the examples of the direct visualization method. In the case of base metals, UT wave which propagates through the buttering has many scattering waves behind the wave front, and has high level noise in A-scan waveform, in contrast to that UT wave in base metal goes straight, has no scattering waves behind the wave front, and has no noise in A-scan waveform.

These experiment is useful for the suitable probe selection in such particular materials.

EJAM2-2NT25-Fig.5a_Verfication_by_the_photoelastic_visualization_method_for_the_coverage_of_reduced inspection_volume EJAM2-2NT25-Fig.5b_Verfication_by_the_photoelastic_visualization_method_for_the_coverage_of_reduced inspection_volume
(a) Inspecttion volume in JSME code is being discussed for reducing to 1/3t (b) Phased sector scanning beam can cover the reduced inspection volume

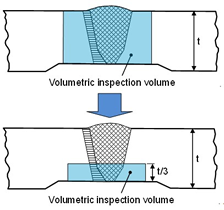
Fig. 5 Verfication by the photoelastic visualization method for the coverage of reduced inspection volume which has been discussed ot JSME code

 
EJAM2-2NT25-Fig.6a_t=6_SUS316_Base_metal t=60 SUS316
Base metal
EJAM2-2NT25-Fig.6b_t=50_Alloy600_type_Buttering  t=50 Alloy600 type
Buttering
EJAM2-2NT25-Fig.6_Results_of_direct_visualization_method
EJAM2-2NT25-Fig.6a3_Results_of_direct_visualization_method. EJAM2-2NT25-Fig.6b3_Results_of_direct_visualization_method
(a) Base metal of SUS 316 (b) Buttering of Alloy 600 type metal

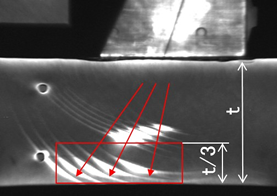
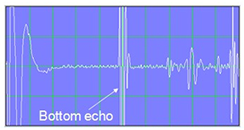
Fig. 6 Results of direct visualization method on base metal and buttering metal

5. Reference
  1. [1] T. Furukawa, H. Yoneyama, Y. Horii, N. Uesugi, "Measurement of Ultrasonic Wave Propagation in Austenitic Stainless Steel Welds", Proceedings of 2nd International Conference on NDE in Relation to Structural Integrity for Nuclear and Pressurized Components, JRC, New Orleans, May 24-26, 2000, B195-B201.
  2. [2] T. Furukawa, H. Yoneyama, Y. Horii, N. Uesugi, "Measurement of Ultrasonic Wave Propagation in Austenitic Stainless Steel Welds -1st Report for the improvement of ultrasonic inspection capability(Japanene)", Proceedings of 1999 Fall Meeting, JSNDI, October 27-29, 1999, pp.23-24.
  3. [3]I. Komura, Y. Ikegami, H. Nakamura, M. Igeta, "Numerical Analysis of Elastic Wave Propagation in Simulation of Ultrasonic Examination", Proceedings of 1st International Conference on NDE in Relation to Structural Integrity for Nuclear and Pressurized Components, JRC, Amsterdam, October 20-22, 1998, pp.967-972.
  4. [4]I. Komura, T. Furukawa, "Simulation Technique for UT Wave Propagation as an Effective Tool for Predicting the Inspection Results and Interpreting the Root Cause of Unexpected Indications", E-Journal of Advanced Maintenance, Vol.1 No.1, 2009, NT 1.
  5. [5]K. Dozaki, Y. Mizutani, M. Kamaya, H. Mochida, M. Iwasaki, T. Shibayama, S. Yamamoto, Z. Makihara, "Study on Modification of Examination Range in Volumetric Inspection for Dissimilar Metal Weld of Class 1 Components and Pressure Boundary Weld of Class 1 Piping", Transaction of the Japan Society of Mechanical Engineers: Series A, Vol.75 No.750, 2009, pp.266-268.
6. Contact
Japan Society of Maintenology (ejam@jsm.or.jp)
backtotop