


| Vol.2 No.4 |
||||||||||||||||||||||||||||||
| General Articles | ||||||||||||||||||||||||||||||
| Vol.3, No.1, GA16 | ||||||||||||||||||||||||||||||
Maintenance Decision Support Project |
||||||||||||||||||||||||||||||
|
Ron Jenkins1, Murray Wiseman2, and Daming Lin3
1 Orica Australia Pty Ltd 2.3 OMDEC Inc. Canada |
||||||||||||||||||||||||||||||
Ⅰ INTRODUCTIONThis paper provides an insight into the challenges faced by the Reliability Engineer before he can exploit Maintenance Decision Support software. The intent of this study is to apply such a tool to critical magnetic pumps at the Orica Laverton North Chloralkali Plant in Australia. Conditioning Monitoring (CM) already existed. Nevertheless unexpected failures have occurred and the need to validate and improve on the CM process was paramount. Reliability based decisions may be assisted with specific types of data relating to equipment operation and maintenance. However, it is important to recognize that large volumes of CM data are no guarantee of good condition based maintenance decision models unless that data reflects the deterioration of failure modes that actually occur. How do we know what condition monitoring variables are significant? This project will attempt to use a software tool that analyses CMMS failure data in conjunction with condition monitoring data in order to identify those monitored variables that influence the probability of occurrence of the targeted failure modes. The methodology applies a Proportional Hazard Model (PHM)2 to determine not only which monitored variables are significant but also the precise probabilistic relationship between those variables and equipment failure. The main objective of this study is to understand the nature of the data required for this. The paper will discuss a data acquisition, cleansing and transformation philosophy for condition monitoring programs that supports practical decision making in maintenance. Ⅱ SCOPEThe study was limited to four pump sets over two years, an admittedly small sample. These pumps are all magnetic pumps with induction motors on caustic service as detailed in Table 1 below.
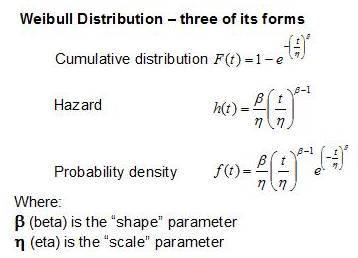
Ⅲ RELIABILITY PREDICTION MODELSThere are many reliability prediction software tools on the market. A basic search on the web reveals a number of vendors [1], [2], [3] for example. This project aims to try out one such program, EXAKT© because it is one of the few that confronts the challenge of achieving verifiable day-to-day decisions based upon the two principal available maintenance data sources: the CBM database(s) and the CMMS database. Reliability prediction is not new. One of the most widely recognised models was developed by Weibull in 1951 [4]. He developed a failure analysis method that provided reliability predictions as well as the level of confidence with which those predictions may be applied.
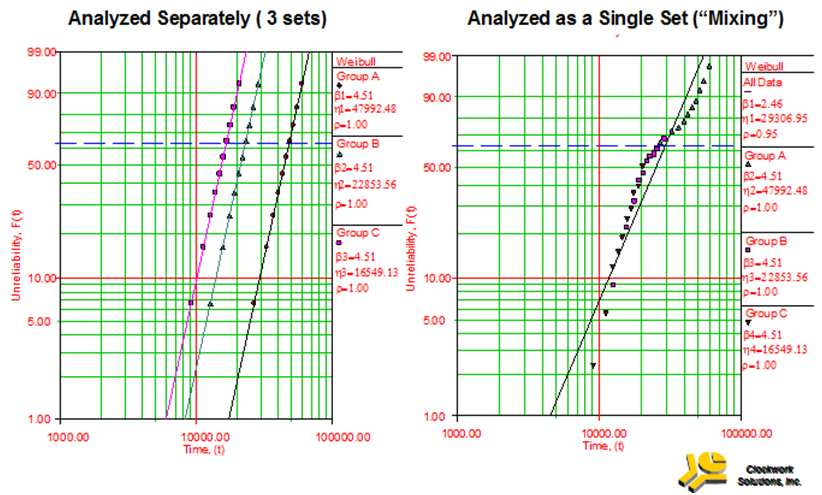
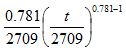
Weibull also showed that the shape parameter β in his equation (above) relating reliability to age provides an indication of likely failure behavior. For a shape parameter of β <1, the Weibull model predicts infant mortality due to poor material quality, incorrect installation, or faulty start up procedures. If β =1 the failure behavior is random, meaning that the failure rate (or conditional probability of failure) is constant and does not change with age or usage. Finally, for β >1, the Weibull model predicts that the failure rate will increase with age due to wear out. Based on the Weibull model having determined that β =< 1 it may be concluded that age based replacement programs, rather than improve performance, could, on the contrary, lead to unnecessary costs, downtime, and poor reliability. If a maintenance strategy called for a randomly failing component (with β = 1) to be replaced preventively at an interval equal to its MTBF = η, then 63% of the time that component would fail prior to PM. To develop a Weibull model we need only determine (estimate from historical data) values for the parameters β and η. The model will yield a variety of data points revealing of the relationship between age and reliability. These relationships when represented graphically help us understand the age based failure behaviour of items and, more usefully, their failure modes.The problem with age based analysis With basic Weibull (age based) analysis practical decision making will often be problematic if populations are mixed or varying conditions influence individual units in the sample. In those cases basic Weibull analysis will tend to underestimate the shape parameter β leading to underestimation of the equipment life. Figure 1 and Figure 2 illustrate a general problem when maintenance engineers use an age-based analysis for proactive decision making. The analysis can often lead to higher than necessary preventive replacement frequencies and costs.
Figure 1 Weibull analysis of individual and combined data sets.
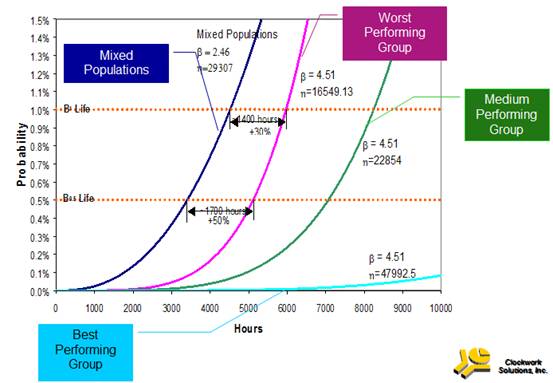
Figure 2 Early life probability graphs of individual and mixed populations – 3 sets of data each yielding a Weibull shape factor of 4.51. The Weibull analysis of the mixed population, however, yields a lower shape factor of 2.46, with significant impact on predicted life. (Ref 7). Apart from the problem of mixed populations, making individual unit repair-now or continue-to-operate decisions armed only with an item’s age is of little value in day-to-day operations. Age in the age-reliability plot is, in essence, a mixture that averages out the effects of other influential yet unspecified variables. Age alone, therefore, obscures the influence of a unit’s individual operating conditions and its current state as reflected by its condition monitored data. This reality has lead to a maintenance strategic approach known as Condition Based Maintenance (CBM). How can Weibull analysis be extended to cover CBM? Proportional Hazard Modelling (PHM) extends the Weibull method to cover today’s CBM reality. It resolves the problem of mixed populations by including, not only age, but also other significant differentiating factors (operational and monitored) in the analysis. The procedure makes use of today’s inexpensive personal computers to handle the intensive computational requirements PHM attempts to “sharpen the saw” by using all available significant prediction factors. These include other plant data obtained from condition monitoring and operational records. The modelling process tests for failure predictability from each available data source. It attempts to identify the significant variables that influence the probability of occurrence of the failure modes of interest. The outcomes from this approach would typically reduce the Weibull shape parameter β such that age based decisions will be superseded gradually (as information management procedures improve) by condition based decisions. Such an evolution in maintenance practice is desirable because condition based decisions tend to be more3 conservative and less costly in the long run than age based decisions. This is due primarily to the fact that CBM tasks (when executed using a decision model based on significant variables) detect potential failures whereas age based preventive maintenance tasks, even if performed excessively frequently, do not totally exclude the possibility that some items will fail functionally. The consequences are higher costs. Confidence in CBM prediction is a function of how correlated the condition monitoring variables are to the failure modes’ deteriorations. The existence of such correlations can be more reliably determined when failures and suspensions4 are accurately distinguished from one another in the CMMS. Business factors, when combined with the proportional hazard model, yield an optimal decision chart (Figure 3A). The chart plots the progressive likelihood of failure and of risk. “Risk” combines both probability and cost. A “crossover” point suggests the optimal moment for repair. The user may set his optimizing objectives in the model. For example, the objective (of a given CBM task relevant to a given failure mode) may be set for cost, availability, profitability or a desired mix of all three. The method also provides a remaining useful life (RUL) estimate and confidence interval (Figure 3B) independently of economic factors.
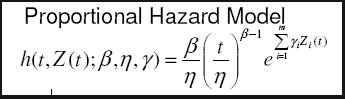
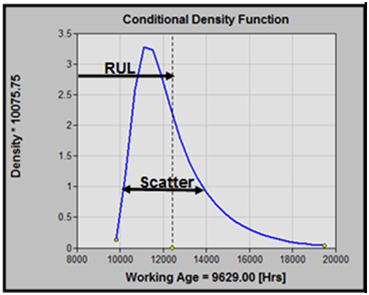 AB Figure 3A Optimal decision chart. Vertical axis: the weighted sum of the values of each CBM variable determined to be significant in the model. Horizontal axis: the current age of the item. Green area: No action. Yellow area (small area between the green and red boundaries): Action required in a specified time. Red area: Action recommended as soon as possible (Item is in a “Potential Failure” state). Figure 3B Conditional Probability Density provides estimation of Remaining Useful Life (RUL) and confidence (standard deviation) based solely on probability. A decision model, such as that illustrated in Figure 3, which is based both on cost and probability will identify the most cost effective moment of intervention (given the current working age and the most recent levels of the significant monitored variables). The two most important organizational requirements for CBM modelling (or for any form of data based reliability analysis for that matter) are that: 1. The failure modes be well identified on the completed work orders, and that 2. The distinction be made between failure (or impending failure) and preventive replacement In a “proportional hazard model (PHM) analysis, the equation of Figure 4 is numerically solved.
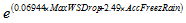
Figure 4 The Weibull model containing the shape, β and scale,η parameters is extended by an exponential factor that contains the parameters γi associated with each significant CBM monitored variable5. The PHM software applies statistical tests for the model fit and for the significance of variables associated with the failure modes and for the overall models goodness of fit.
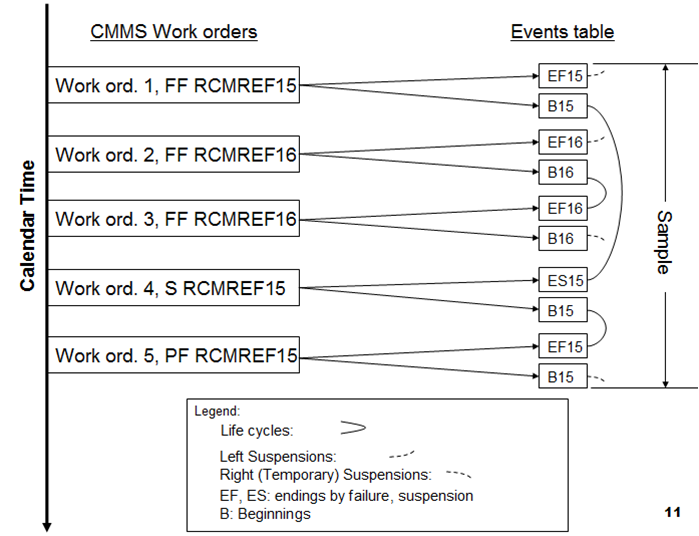
Ⅳ DATA COLLECTION & SCREENINGThe phrase “rubbish in equals rubbish out” could not be more applicable when attempting to analyse data using a software reliability analysis tool. With PHM based analysis, data quality is of great concern since the results of the analysis are intended to be used day-to-day for practical decision making. The user of the software must have a good understanding of the equipment under analysis, its failure modes, and the monitored variables likely to be influential factors that reflect failure mode deterioration. The software confirms or refutes such assumptions using intensive computations based on statistical techniques. If the hypothesis that a CM variable is significant is confirmed (not rejected at the 5% significance level) by the software, the reliability engineer will obtain a probabilistic relation among: 1. significant variables, Subsequently, the method applies a “predictive” algorithm6 in combination with the PHM to generate a Remaining Useful Life Estimation (RULE) model. Once developed and accepted the model will be deployed as an agent “watchdog” silently scanning condition monitoring data as it appears in designated database locations. The agent writes the results into a database table accessible to the Reliability Engineer and the Maintenance Manager via the normal CMMS reporting system. A. Failure data At the Laverton site the CMMS is used to raise work orders, issue permit to work forms and report equipment failure history. Fields available to be completed on work order closeout include “observations, cause, components and comments”. The data extraction process for the pumps found comments ranging from general statements such as “removed-damaged” to observations like “OK”. In many cases there was no attempt to identify failure modes or causes (e.g. dry running or cavitation) or to distinguish between a potential failure and a suspension. We at Orica hasten to point out that the technicians themselves are not to “blame” for such communication gaps. CMMS trainers focus on the mechanics of manipulating the software rather than on encouraging precise Reliability Centred Maintenance (RCM) styles of expression of field observations into readable descriptions of as-found equipment state. As a result, given the pride in their work held by technicians, their commentary text includes largely descriptions of “what I did” and fewer descriptions of “what I found”. Both, of course, are required for Reliability Analysis. The data available from the CMMS was, therefore, unsuitable for loading directly into the reliability analysis software. Two obstacles were encountered. Firstly, the structure of the CMMS data is not that which is needed for generating a sample. A sample of life cycles (discriminating between ending-by-failure and ending-by-suspension) is necessary before reliability analysis can be performed. The issue was resolved relatively easily using data mapping and transformation algorithms (illustrated in Figure 5).
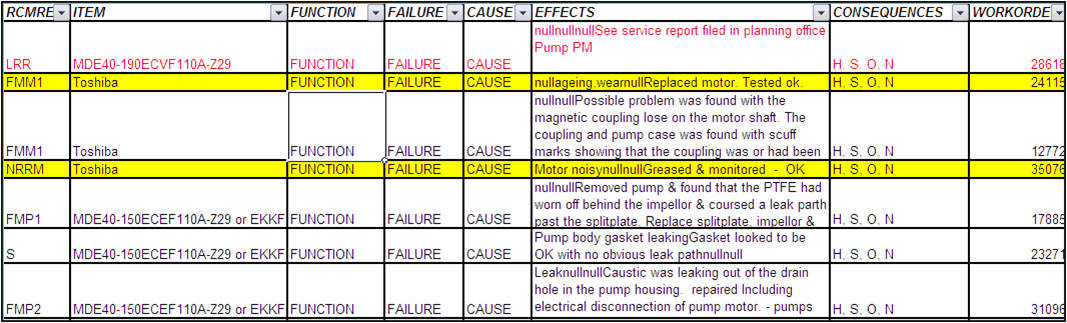
Figure 5 Transformation of CMMS data to a Sample for Reliability Analysis Because a sample is a collection of life cycles it is impossible to develop a sample directly from the CMMS’s structural representation of work order history. Figure 5 above indicates that the data in the CMMS must be transformed to a structure wherein life cycles are identifiable and countable. Both complete and partial (suspended) life cycles in the sample must be accounted for by the reliability analysis procedure or software. Furthermore the best way to ensure an unbiased sample is to select two points in calendar time that define the sample window. One selects the window width such that there are a sufficient number of life cycles for analysis. Sufficiency depends on several factors one of which is how closely the condition monitoring data reflects the true health state of a given failure mode. External variables reflecting operating context within mixed populations should be identified and accounted for in the model. The second obstacle, on the other hand, is far more daunting. In some cases it was difficult to determine if the pump had failed or if the work order represented a suspension. Mistaking a suspension for a failure will mislead the analysis and modelling into mistakenly associating preventive repair with failure. That is, the model will “try” to correlate values of condition monitoring variables occurring at a time when the component is actually in good condition, with a failure event. This will have the effect of introducing scatter (i.e. lowering confidence) in the model’s predictive capability. The most basic data requirement, therefore, of reliability analysis (Weibull, PHM, and most others) is to distinguish between failure and suspension when reporting the as-found condition of each significant failure mode encountered during the execution of a work order. B. Working Age In any reliability study the working age of the equipment is important. Working age is a reference line measuring the accumulated usage of, or stress on, a component. The engineering units selected for working age should reflect the accumulated normal wear and tear on the component. Calendar age is appropriate when the equipment operates more or less uniformly. Energy consumed or production units delivered often provide a better indication of true working age. Pump operating hours were not easily available and had to be estimated based on the date of the work order and known operating practices for the pumps. For example, the two catholyte pumps shared the same duty and swapped from online to standby every two weeks. Knowing this, the working age could be estimated based on calendar dates, average plant uptime, and 50% run time. The other two pumps ran continuously and the working life was based directly on the work order’s date. C. Vibration data Condition monitoring (CM) on site at Laverton has been used for over 9 years. This includes vibration analysis (VA) of all pump sets, fans and compressors. The CM is conducted by a specialist external contractor. Critical drives that have standby redundancy are changed over regularly to ensure that they still run. Standby units are started up to perform VA. The VA data is compiled by the Contractor and an executive summary forwarded to Laverton each fortnight. The VA report attributes to each of the rotating machines a performance rating of “1” to “5”. When machines reach level 3 we begin to monitor closely, at level 4 we plan to replace at next opportunity and if level 5 we would replace immediately. No “scoreboard” is kept to tally hits, misses, and false alarms by this condition monitoring program. (Doing so, in a “Living RCM7” project, is an important conclusion of this study.) If the VA reported equipment condition is so severe and a decision to replace is made, it will have significant production impact. An example is a magnetic drive pump motor on the Catholyte system that was exhibiting excessive noise. A decision was made to replace the motor rather than risk an unplanned trip (potentially occurring only hours later). When faced with a decision to shutdown and replace an item the level of confidence in making that decision is, for the aforementioned reasons, not known. Some pumps have been known to run for extended periods at high vibration levels without the need for replacement. This implies that factors, others than those reported by VA, influence failure probability. It is incumbent then, upon the organization and its reliability engineers, to identify, through observation and analysis, those internal and external factors likely to influence production and profitability. D. Operational History Another source of information was obtained from the plant Distributed Control System (DCS) alarm history logs. This source of data assisted with confirming pump working ages by flagging stop and start events. Ⅴ DATA CLEANSING & TRANSFORMATIONA. Data Cleansing Before using reliability analysis software a number of steps are required to cleanse and transform the data. 1) Prepare or update the Failure Mode and Effects Analysis (FMEA) for pump and motor. The FMEA constitutes a “knowledge base” each record of which describes a failure mode whose behavior is to be determined by the “counting up” (i.e. basic reliability analysis) of the work order instances of that failure mode.2) Identify the failure modes from the work orders and link them to the FMEA. Each link represents an ending and beginning event in the sample (see Figure 5). 3) Correlate VA data to the pump failure and suspension events using a technique such as PHM. Refer to Table 3. 4) Ensure that any PM activities are properly allocated to either suspension or failure events of the pumps. 5) Use the DCS recorded top/start events, if necessary, to determine pump working age at each life event (i.e. work order). 6) Before modelling use the data validation function in the software to locate, repair or eliminate erroneous and illogical data. A common example of the latter would be an Event or Inspection record containing a working age at a later date that is lower than a working age at an earlier date. 7) Create beginning events where life cycles began prior to start date of the sample window. 8) Ensure that failures and suspensions are accurately identified and distinguished. Confirmed “potential” failures should be counted as failures. Well discussed maintenance department standards should distinguish failures from suspensions. Surprisingly, FMEA for the basic magnetic pump and even the standard induction motor were difficult to find in the public domain. Many references to the method are available however no specific analysis could be found. The study developed a FMEA model (by mining the work order history) for the pumps and motors and this was used to identify the significant failure modes of interest. One of the surprising outcomes from the pump analysis was that pump failures were largely related to operational factors rather than to intrinsic mechanical defects. The next step was to link the CMMS data associated with failures with the different failure modes from the FMEA. Refer to Table 2. One important step is to assign the work order history with beginning and end dates for pump or motor events, paying particular attention to failures or suspensions8 . Refer to Table 4.
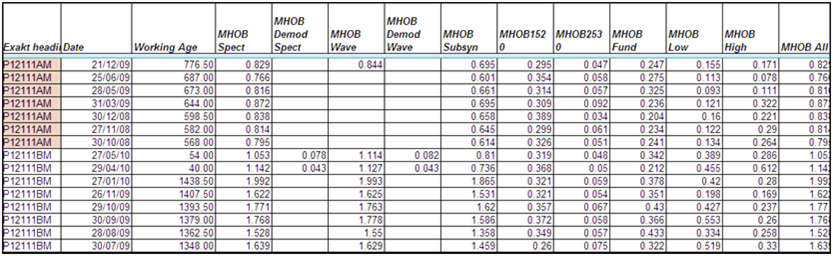
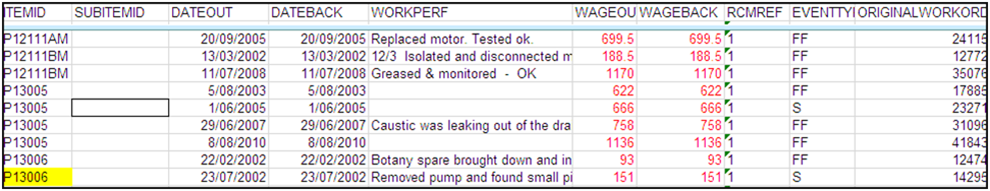
Table 2 Some failure mode data from the work orders Table 3 Vibration data Table 4 Some work order records with RCM reference and Event type Ⅵ RESULTSThe study identified that vibration variables did not strongly associate with the failures reported. In fact the results indicate that most failures were due to operational techniques, rather than to mechanical deterioration. This is considered a valuable finding of the study as it does indicate the area on which to focus asset management training as well as the CBM program itself. For the former, a lesson is to spend more time in training operators on correct pump operation. For the latter, we may examine the returned value of the VA program. It is recommended to track (through a living RCM process) VA’s good and bad calls in order to have an evaluation of the program’s predictive performance. Such an evaluation, consistent with continuous improvement, will result in more a more effective CBM program. The objectives of improvement are 1) Discrimination of failure and suspension leading to more dependable decision models, and2) determination of vibration or other condition monitoring extracted features that reflect actually occurring failure modes. Ⅶ CONCLUSIONSThis was a preliminary study based on a small sample of pumps operating over only a two year period. The authors intend to expand the sample and to apply the lessons learned relative to the management of failure and suspension data, particularly the following: 1. Improve the management of the work order to account for RCM relationship by identifying both the failure mode and the Event type (either PF, FF, or S) on the work order.2. Report the failure mode as a reference to a FMEA record where it is defined in the context of the Function, Functional Failure and Effects. 3. Include in the free text field of the work order both “what was found” as well as “what was done”. 4. Update the FMEA dynamically, based on day-to-day observations surrounding the execution of a work order. The work order free text should, to the extent justified, support updates to the Effects text field of a FMEA/RCM record in a continuous process of knowledge refinement. The work order free text should be examined by the reliability engineer in order to expand the Effects text of the RCM knowledge base to cover all reasonably likely situations that may arise in the course of the enterprise’s operations. Feedback and exchange of these concepts with the technicians should occur regularly. 5. Understand the requirements for an unbiased sample before attempting Reliability Analysis. The characteristics of a sample for reliability analysis are illustrated in Figure 5. 6. Perform Reliability Analysis. This is, relatively speaking, the easiest part of the entire process as long as the considerations discussed thus far have been understood and respected by the reliability engineer and maintenance personnel involved in the work order process. ACKNOWLEDGEMENTThis paper acknowledges the following people: COMMENTARY1EXAKT© CBM Decision Optimization (www.omdec.com/wiki) REFERENCES[1] http://www.reliasoft.com/products.htm[2] http://www.plant-maintenance.com/ [3] http://www.isograph-software.com/ [4] Weibull, W. (1951), "A statistical distribution function of wide applicability", J. Appl. Mech.-Trans.ASME 18 (3): 293–297 . [5] Jardine A.K.2, Banjevic D., Wiseman M.., Buck S. and Joseph T. “Optimising a Mine Haul Truck Wheel Motors’ Condition Monitoring Program: Use of Proportional Hazards Modelling”, http://www.omdec.com15oxie/About/cases/ [6] Living RCM and EXAKT, http://www.livingreliability.com/en [7] Mixed Populations Mathematical Basis, Naaman Gurvitz, Clockwork Solutions Inc. http://www.clockwork-solutions.com [8] http://www.omdec.com/wiki/tiki-index.php?page=The+elusive+PF+interval |
|
Vol.10 No.2(Aug) |
|
| < Other Issues | |
|---|---|
 |
A New Mechanical Condition-based Maintenance Technology Using Instrumented Indentation Technique |
 |
Survey robots for Fukushima Daiichi Nuclear Power Plant |

Contacts
(EJAM): ejam@jsm.or.jp
(JSM): secretariat@jsm.or.jp
HP: http://www.jsm.or.jp
(in English)
![]()