
| Vol.9 No.1 |
| General Articles |
| Vol.9, No.1, GA21 |
Severe Weather Data near Nuclear power Station and Reprocessing Fuel Facility in Japan |
|
Tadahisa Nagata |
Abstract
The main weather data are updated at any time. The strong wind and tornado (strong wind/tornado) data are
opened until March 2016 in Japan. The main weather and the strong wind/tornado data near the nuclear
power station (NPS) were investigated. The earthquake, Tunami and volcano were not mentioned on this
report. The main weather data might not be severe. The maximum temperature had not been considered in the
safety analysis of NPS. The weather data of some small observation posts near NPSs had not been considered.
The unusual high temperature and the local severe rain near NPS by the global warming may be considered in
future. The maximum intensities of the strong wind/tornado in Japan and near NPS were Fujita-scale 3 and 2,
respectively. The maximum intensities of almost half NPSs were Fujita-scale 1. The intensity and the number
of the strong winds/tornados differed depending on NPS. The Japanese main weather and strong wind/tornado
might not be severe compared with other country.
1. Consideration of WeatherThe data of the main weather are updated at any time. The data of the strong wind and tornado (strong wind/tornado) are sometimes updated. These data are opened the Japan Meteorological Agency (JMA). The strong wind/tornado data until March in 2016 were opened on March 2017. This report mentioned the main weather, and the strong wind/tornado near the nuclear power station (NPS) and the reprocessing fuel facility (RFF) before March 2016. The appendix should be attached to the application for a establishment license of the nuclear power plant in accordance with the law and rules of Japan. The weather data ,the strong wind/tornado, earthquake, Tsunami and volcanic eruption near NPS and RFF are mentioned on these appendixes. This report does not mention the earthquake, Tsunami and volcanic eruption. The weather data on these appendixes were obtained from JMA. Table 1 shows the main extreme weather data on the appendix of the safety review and in Japan. Table 1 Main Weather Data of Appendix
A local office of the Ministry of Land, Infrastructure, Transport and Tourism reported the local heavy rain in Kanto area. It rained heavily within the area of 5~50km2 [1]. The weather data of some small JMA observation posts of which distance from NPS are less than 4km ≅√50km2÷Π were not mentioned on the appendix of NPSs. In future, it may be necessary to consider the severe weather data of some small observation posts near NPSs. Table 2 shows the main incident at NPS caused by the typhoon. These data are reported in the NUClear Information Archives (NUCIA) Database in Japan. The incidents by the typhoon might happen at some specific NPSs. The rainwater poured into the building of some plants. However, almost all plants suffered only slight damages. Recently, the nasty weathers which were not severe caused some incidents at NPSs. Table 3 shows the incidents at NPSs by the nasty weathers. These incidents happened during the improvement construction. The local weather condition during the construction should be paid more attention to. Table 2 Main Incident caused by Typhoon
Table 3 Incident by Nasty Weather
The road and the electric power supply line out of NPS were sometimes damaged by the severe weather. The heavy snow or the landslide cut the electricity supply off. The passages were sometimes closed on the roads to NPS by the landslide, the heavy snow or the strong wind. Table 4 shows the examples of the incident near NPS. Table 4 Incident near NPS
2. Strong Wind and Tornado in JapanJMA has been recording the data of the strong winds including the tornados from 1961 onward. The data after April 2016 were only prompt information. The detail data from 1961 to March 2016 were investigated on this report. It notes that the enhanced Fujita-scale will be applied for the data after April 2016 in Japan. The number of data was 1693. Maximum intensity of the strong wind/tornado was Fujita-scale 3 (F3) which was not enhanced Fujita-scale 3. The number of F3 winds/tornados including F2~F3 was only eleven. Fig. 1 show the Fujita-scale of the strong wind/tornado in Japan. Fig. 1 F-Scale of Strong Wind and Tornado in Japan. 2.1. Movement Distance1,435 data had the location information (latitudes and longitudes of the appearance and disappearance). The movement distance from the appearance to the disappearance was calculated based on these location information.
Fig. 1 F-Scale of Strong Wind and Tornado in Japan Location information of three tornados between 50~100km distance included imperfect data. These three tornados might be excluded for the analysis of the movement distance and the next sections §2.2 and§2.3. Fig. 2 shows that all strong winds/tornados excluded these three tornados run less than 50 km.
Fig. 2 Movement Distance of Strong Wind and Tornado 2.2. Effect by MountainThere are many mountains and few flats in Japan. Mountains might block the way of the strong wind/tornado. The appearance altitudes and the disappearance altitudes were calculated based on these location information of the strong winds/tornados. The altitudes were calculated using NASA data. Fig. 3 shows the difference of the altitudes. The number of 0 was 851, and the distribution might be almost bilateral symmetric. Fig. 4 shows the example of the strong wind which climbed up the mountain. This figure shows that the strong wind/tornado might finish climbing the mountain of a few hundred meters.
Fig. 3 Altitude difference (Disappearance - Appearance)
Fig. 4 High Clime-up Strong Wind 2.3. Strong Wind and Tornado near NPS/RSFThe strong winds/tornados moved less than 50km as above mentioned. The location information and the movement distance by the calculation have some uncertainties/errors. Therefore, the strong winds/tornados which appeared within 60 km from NPSs and RFF were investigated on this section. Fig. 5 shows the Fujita-scale of the strong winds/tornados near NPSs and RFF. The number and Fujita-scale of strong winds/tornados differed depending on NPSs and RSF as below mentioned. (1) Maximum intensity was F2 near the NPSs/RFF. Maximum intensity near eight NPSs was F1. (2) Many strong winds/tornados appeared near Kashiwazaki-Kariwa, Hamaoka, Shika, Mihama, Tokai-Daini and Tsuruga NPSs. On the other hand, the number of the strong winds/tornados near Higashidori, Ikata NPSs and Rokkasho RFF was very few. Fig. 6 shows the example of the strong winds/tornados near NPS; Kashiwazaki-Kariwa. The green marker; P is NPS. The blue line was not the way but a straight line from the appearance to the disappearance of the strong winds/tornados. The blue dot is the appearance place, in case that the appeared location was the same as the disappeared location, or the disappeared location was unknown.
Fig. 5 F-Scale of Strong Wind and Tornado and near NPS
Fig. 6 Strong Wind and Tornado near Kashiwazaki-Kariwa NPS
3. Hail in Japan
In the EU stress test, the damage by the hail may be evaluated. However, the damage by the hail has not been evaluated in Japanese safety review.
3.1 Hail in JapanIce stone of which the diameter is more than 5 mm is named “Hyou” in Japanese. Ice stone of which the diameter is less than 5 mm is named “Arare”. The hail means “Hyou” (which is larger and heavier ice stone) on this report. It usually hailed at the east area of Japan (Hokkaido, Tohoku and North Kanto region). And it hardly hailed at the west region of Japan. Fig. 7 shows the hail in Japan on the website of the National Research Institute for Earth Science and disaster Resilience (NIED) [2]. Table 6 shows the incident by the hail in Japan. The damage by the hail might be very few in Japan. (figure7,table6)
Fig. 7 Hail in Japan Table 6 Incident by Hail in Japan
3.2 Destructive Power of hailTable 6 shows that the diameter of the almost hail was less than 5-6 cm. The particle like the hail has the air resistance in proportion to the square of the speed during the fall-down, and the fall-down speed reaches a constant speed (final speed). The final speed of the hail of which the diameter is 5cm is 33m/sec on the website of NIED [3]. The destructive power by the hail of which the diameter was 5cm compared to the destructive power by the bullet. The kinetic energy of the bullet and the hail may be evaluated as the destructive power. The specific gravity of the ice is 0.92 [4]. The weight of the hail of which diameter is 5cm is 60.2 (gr). The hail kinetic Energy; KE is the equation below. The destructive power of the bullet is dependent on the pistol. Table 7 shows the example of the destructive power [5]. The destructive power of the hail is about a half of the golf bowl power. The hail may not damage NPS and RSF in Japan. Table 7 Destructive Power of Bullet
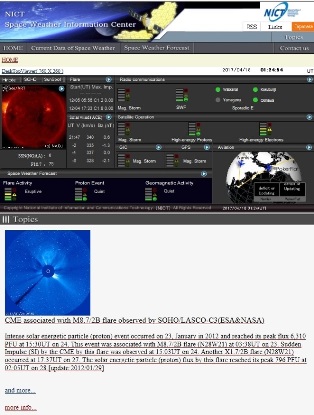
Fig. 8 Website of Space Weather Information Center 4. Solar Wind / Magnetic StormNot only the NPS/RFF but also all industrial equipment might not been damaged by the solar wind and magnetic storm in Japan. However, aurora was rarely seen in Hokkaido. In future, Tomari NPS in Hokkaido may be influenced by the strong solar wind and magnetic storm. The Space Weather Information Center of the National Institute of Information and Communications Technology (NICT) provides the data of the solar activity. Fig. 8 shows the website of the space weather information center of NICT. These data may be referred for (Tomari) NPP. 5. ConclusionThe Japanese weather may not be severe as below mentioned. - The weather might not be severe compared with the weather of the other countries. - The number and the intensity of the strong winds/tornados differed depending on the NPSs and RFS. These intensity might not be stronger than the intensity of the other countries. - The damages by the hail were very few. The destructive power of the hail is small. However, the intensity of the bad weather may be more severe in future. And we have to observe the violence of the severe weather. References
[1] Koji Nakajima: "Verification of the precipitation
observation station for the recent local heavy rain",
Skill /up seminar in Kanto 2013/7/3-7/4 [published
in Japanese]
[2] National Research Institute for Earth Science and disaster Resilience: "The distribution of the hailstorm days.", Disaster prevention basic lecture of Disaster Information Laboratory [3] National Research Institute for Earth Science and disaster Resilience: "10. Snowfall Accumulation・ Lighting・Hail", Disaster prevention basic lecture of Disaster Information Laboratory [4] Wikipedia; Ice, [5] Power of Bullet, http://9uranium2.web.fc2.com/ |
|
Vol.10 No.2(Aug) |
|
| < Other Issues | |
|---|---|
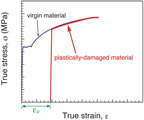 |
A New Mechanical Condition-based Maintenance Technology Using Instrumented Indentation Technique |
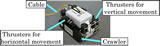 |
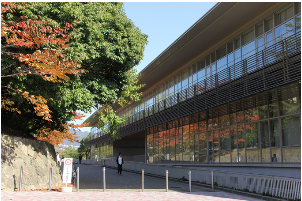
Survey robots for Fukushima Daiichi Nuclear Power Plant |

Contacts
(EJAM): ejam@jsm.or.jp
(JSM): secretariat@jsm.or.jp
HP: http://www.jsm.or.jp
(in English)


![]()