


Classification
2 - B
TEPSYS has developed new methods for the condition monitoring and the plant diagnosis by applying the signal analysis technology to the process signal data acquired by the transient recorders (data acquisition system to record process signal data automatically with high sampling rate when transient event occurs) and the portable data recorders as shown in Fig.1. These methods have been applied to 13 BWRs in Japan.
TEPSYS also supplies such transient recording system, the signal analysis software, and the condition monitoring system like the BWR stability monitor.
The condition monitoring and the plant diagnosis by signal analysis (or noise analysis) is the technology which contributes to increase capacity factor of the nuclear power plant as a part of the condition based maintenance technology by evaluating plant condition during plant operation. In this technology, fluctuation in the process signal (which is usually treated as 'noise') is analyzed. The information with regard to the condition of plant, component, and instrumentation can be extracted from the ‘noise’ by applying the FFT (Fast Fourier Transform), the AR (Auto-Regressive) modeling, and so on. This kind of idea has been used in the reactor noise analysis, and has also been applied for the condition monitoring, the plant diagnosis, and the trouble shooting.
By applying the signal analysis technology, it is possible to check the condition of plant components remotely which are difficult to confirm by conventional maintenance method. Therefore, it is possible to reduce the dose of the radioactivity during the inspection work, and also to prevent plant component failure during plant operation, unexpected plant shutdown, and extension of the regular inspection period. For an example, when detecting the degradation signs of the mechanical seal in an early stage, progress of the degradation during operation can be prevented by reducing the load of the corresponding pump. Furthermore, by preparing replacing parts beforehand and optimizing the repair schedule, efficient repair work is possible and it can also contribute to shortening of a regular inspection period. Some other application examples of this signal analysis technology are also illustrated in Section 5 below.

Fig. 1 The flow diagram of the condition monitoring and the plant diagnosis by the signal analysis
Phase 3:Publicly-accepted Phase
- (1) Components: Active Components (Pump, Valve, Mechanical Seal), Static Components (LPRM, Sensing Line, Sensor, Controller, Power Unit), BWR, PWR
- (2) Location: regardless of location
- (3) Material: Regardless of material
- (4) Condition: during operation
- (1) Applicable during the plant operation
The process signal data acquired during plant operation is used. So, it is possible to perform the condition monitoring or a part of regular inspection during plant operation.
- (2) No disturbance to the plant operation
The process signal data acquired under normal operating condition is used. (ex. The response function between the controller and the controlled components (like valves) can be estimated by using the process data under normal operation.) Therefore, it is not necessary to perform the response test (like valve test), which disturbs to plant operation
- (3)No new instrumentation necessary
The process signal is obtained from the installed instrumentation. Therefore, it is not necessary to install new sensor, measurement system, or instrumentation.
- (4)Can be applied to any types of components
The discrete digitalized signal data is analyzed. Therefore, it is regardless where the signal comes from. That is, it is possible to apply to any type of components.
- (5)Remote monitoring, diagnosis
The process signal is obtained from the installed instrumentation, and is digitalized to be handled by the software. Therefore, it is not necessary to access directly to the components. That is, it is possible to diagnose remotely such components in the reactor containment.
The examples of actual experiences at commercial nuclear power plants in Japan are shown bellow.
- (1)The detection of (partial) blockage in sensing line
By the spectrum analysis (or APSD: Auto Power Spectrum Density), it is possible to detect the partial blockage in sensing lines for flow rate, pressure, and level. As shown in Fig.2, the APSD level of MS Flow D below 3Hz is lower than the other lines. This is the clear sign of the partial blockage in a steam flow rate sensing line.
Generally, the partial blockage in the sensing line works like a mechanical filter which reduces pressure fluctuation. This causes response delay in the measurement system. This type of phenomena can be observed as the APSD level decrease.

Fig. 2 Auto Power Spectrum Density for the case of the blockage in flow sensing line
- (2)The detection of break in flow sensing line of jetpump
By the coherence analysis, it is possible to confirm the break in flow rate sensing line of the jetpump. As shown in Fig.3, the coherence level below 1Hz is much higher than that of normal cases. This is the clear sign of the break in jetpump flow sensing line. Generally, it is not easy to distinguish the break in flow rate sensing line from other troubles like piping blockage, sensor failure, and so on. However, the coherence indicates much higher level only in case of break. Therefore, it is possible to confirm if the sensing line is broken or not by the coherence analysis.
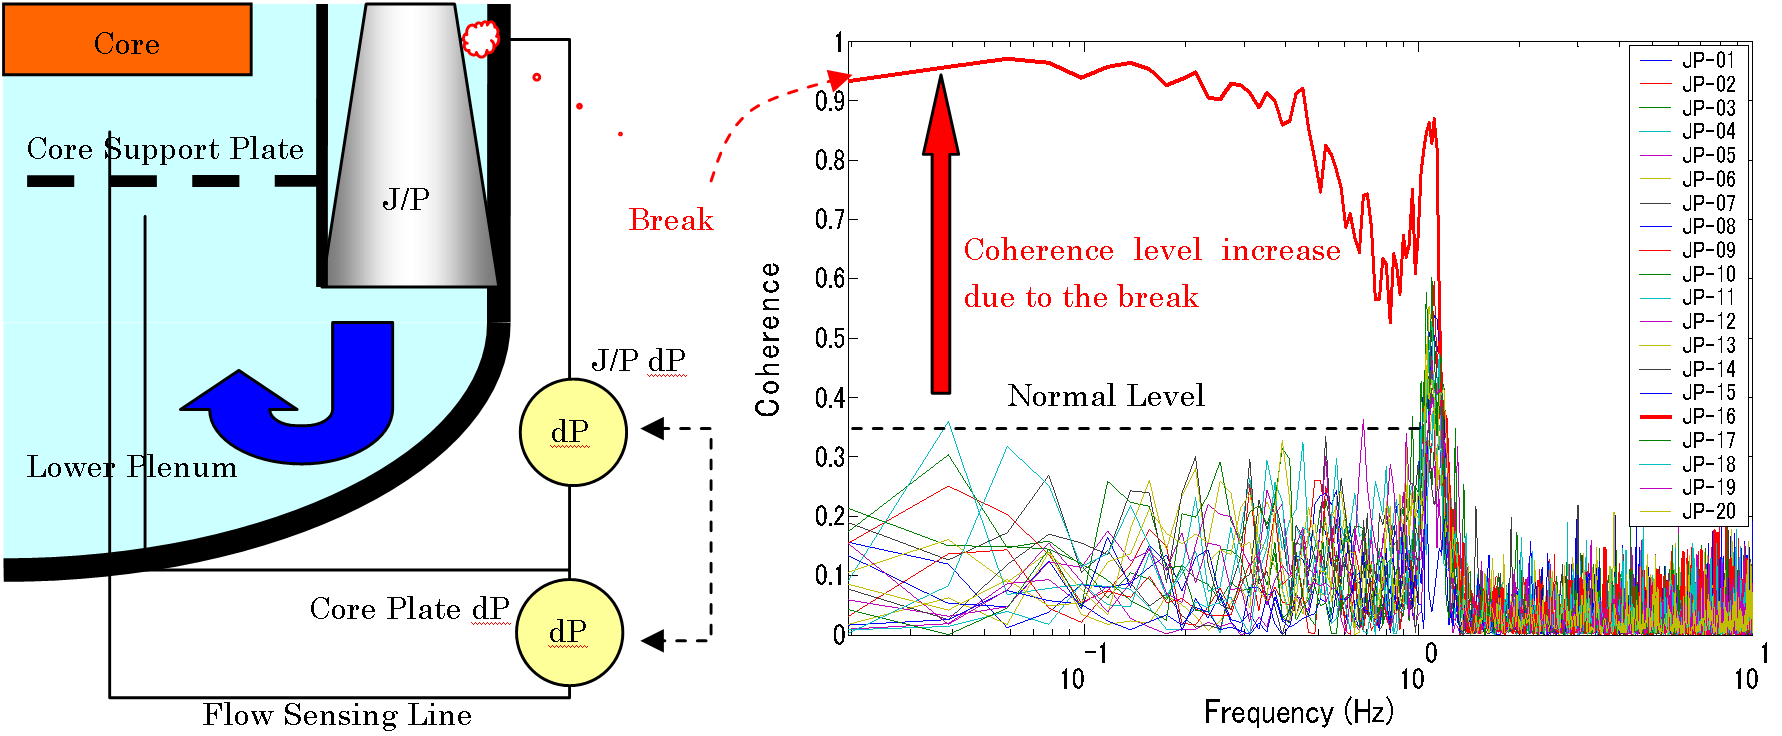
Fig. 3 Coherence for the case of break in jetpump sensing line
- (3)The detection of degradation of mechanical seal
By the spectrum analysis, it is possible to detect the degradation of the mechanical seal at early stage (several months before the actual leakage). Figure 4 shows an example of the mechanical seals for Primary Loop Recirculation Pumps (PLR-P) A&B in BWR. As shown in this figure, the APSD level below 3Hz of the degraded mechanical seal indicates higher level than that of normal one.
In the case of the degradation of the multi-stage type mechanical seal, small fluctuation is observed in cavity pressure after the 2nd stage. This is easily observed as the increase in APSD level by the spectrum analysis.
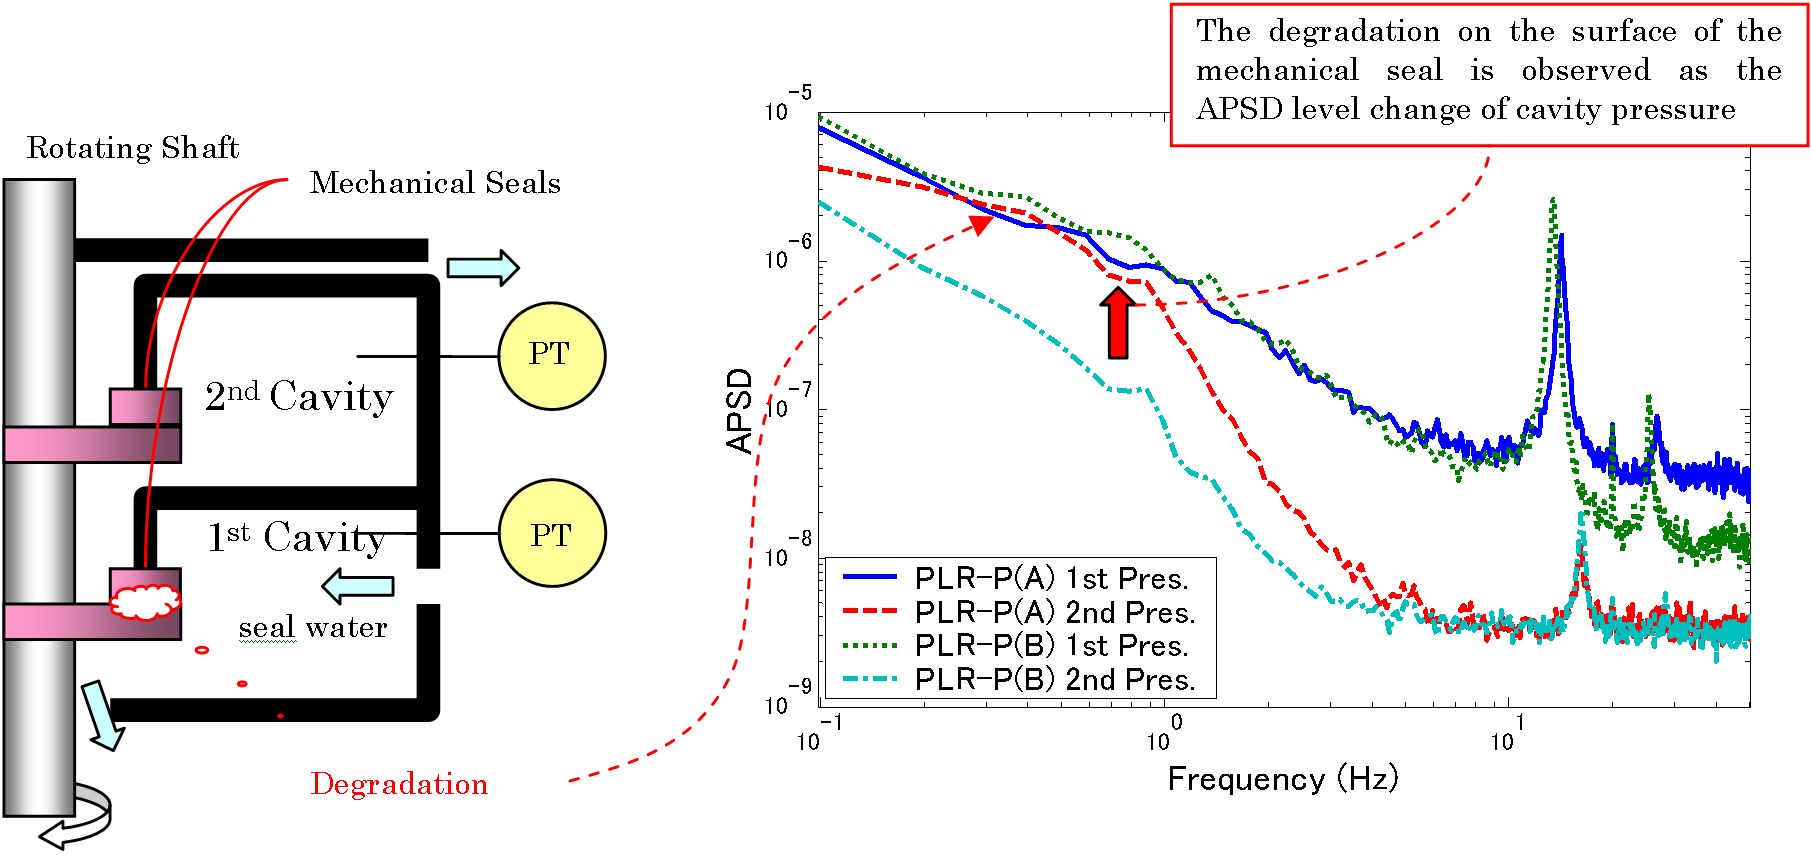
Fig. 4 Auto Power Spectrum Density for the case of degradation of mechanical seal (PLR-P = PLR Pump)
- (4)Applications
a) The detection of miss-connected LPRM cables By the phase and the coherence analysis, it is possible to detect the miss-connected LPRM cables both before plant startup and during plant operation. It is also possible to identify the pattern of the miss-connection.
b) The evaluation of the degradation of electrolytic condenser By the spectrum analysis, it is possible to evaluate the degradation of the electrolytic condenser due to aging in the power unit.
- [1]O. Kubota, A. Maki, T. Uegata, K. Inoue, The Experience of Noise Analysis Applied to Commercial BWRs(1), (2), 2007 Annual Meeting of the AESJ, Nagoya Univ., March 27-29, 2007
- [2]O. Kubota, A. Maki, T. Uegata, K. Inoue, The Experience of Noise Analysis Applied to Commercial BWRs, ICONE 15, Nagoya Univ., April 22-26, 2007
- [3] O. Kubota, A. Maki, T. Uegata, The Application of Noise Analysis to find the miss-connected LPRM Cable Connectors, 2007 Fall Meeting of the AESJ, Kita-Kyushu, September 27-29, 2007
- [4] O. Kubota, A. Maki, T. Uegata, The Application of Noise Analysis to find the miss-connected LPRM Cable Connectors, 2007 ANS/ENS International Meeting, Washington DC, November 11-15, 2007
- [5] O. Kubota, A. Maki, T. Uegata, The Application of Noise Analysis to find the miss-connected LPRM Cables before Plant Startup, ICONE 17, Brussels, July 12-16, 2009
- [6] K. Mori. O. Kubota, A. Maki, The Application of Noise Analysis to find the miss-connected LPRM Cables before Plant Startup, 2009 Fall Meeting of the AESJ, Tohoku Univ., September 16-18, 2009
- [7] O. Kubota, A. Maki, T. Uegata, The Experience of Noise Analysis Applied to Commercial BWRs(3), 2009 Fall Meeting of the AESJ, Tohoku Univ., September 16-18, 2009
Japan Society of Maintenology (ejam@jsm.or.jp)