


TEPCO SYSTEMS CORPORATION (TEPSYS):Daisuke Fujiwara, Hiroshi Shirai, Takumi Noujyu
TOKYO ELECTRIC POWER COMPANY HOLDINGS (TEPCO HD): Hidetaka Imai, Kenichi Bando, Fumitaka Ikeda, Takashi Takiguchi, Ryosuke Katayose
Vol. 11, No. 3, NT95
Development of Decision Making Support Tool for BWR Containment Venting under Severe Accident
KEYWORDS:
BWR, Severe Accident, Containment Venting, Decision Making, MAAP
1. Technical summary
Classification
3 - C
Under the severe accident of nuclear power plant (NPP), the Technical Support Center (TSC) will be organized in NPP to support plant operators and to take over the decision making of accident management. The TSC personnel have a responsibility to predict the accident progress to provide advice for accident mitigation measure or to inform to off-site stakeholders. One of the most important decision is related to Primary Containment Vessel (PCV) venting to reduce containment pressure to protect PCV boundary. In the case of loss of ultimate heat sink, the decay heat of nuclear fuel will increase PCV pressure that finally reaches to upper pressure limit of PCV boundary. The PCV venting is effective mitigation measure to secure heat sink of decay heat, to remedy PCV over pressure, and to reduce PCV gaseous leak into secondary containment. The negative aspect of PCV venting lies in the release of radioactive materials into atmosphere, even though that impact will be suppressed with several accident mitigation measure and equipment, such as PCV spray system, pH control system, scrubbing in suppression pool, Filtered Containment Vent System (FCVS), and so on.
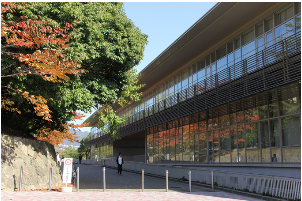
To support TSC personnel activity to predict accident progress, TEPCO HD and TEPSYS has been developed “Decision Making Support Tool for BWR Containment Venting” for fast and easy prediction without highly skilled experiences to run calculation code [1],[2],[3]. Especially, since the TSC personnel are assumed to be under the urgent and stressful condition, there is a difficulty to handle more sophisticated severe accident calculation code , such as MAAP [4] directory. This tool works on standalone laptop PC, to be able to use any place in the accident condition. The screen shots of “start and scenario input window” of this tool are shown in Fig. 1 and Fig. 2. The tool can be utilized as both single-unit and multi-unit accident analyses mode.
The input data for this tool are accident scenario and mitigation measure. To reduce user’s burden under the urgent situation, the input data is selected to requisite minimum reflecting on-site user experiences and opinions as shown in Fig. 1. The tool predicts major plant parameter trends such as, RPV pressure/water level, PCV pressure/gas temperature/hydrogen concentration, and radioactive material release as shown in Fig. 3. The PCV pressure trend will be utilized to understand coming PCV vent timing. The PCV vent timing and amount of radioactive material release into environment will be major output of this tool, which are utilized off-site dose analysis with other dispersion analysis code DIANA [5]. For the conservative accident progress prediction, the tool does not assume that once stopped water injection function will be recovered again.
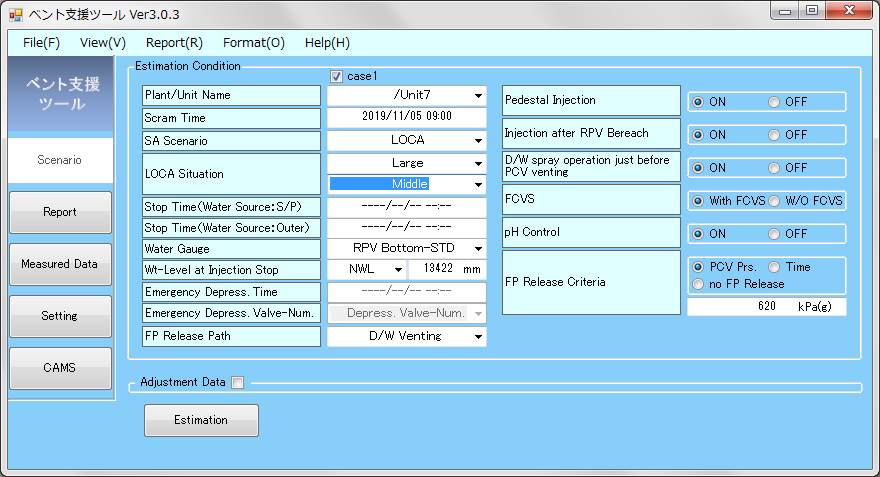
Fig. 1 Screen shot of scenario input window (Single-unit mode)
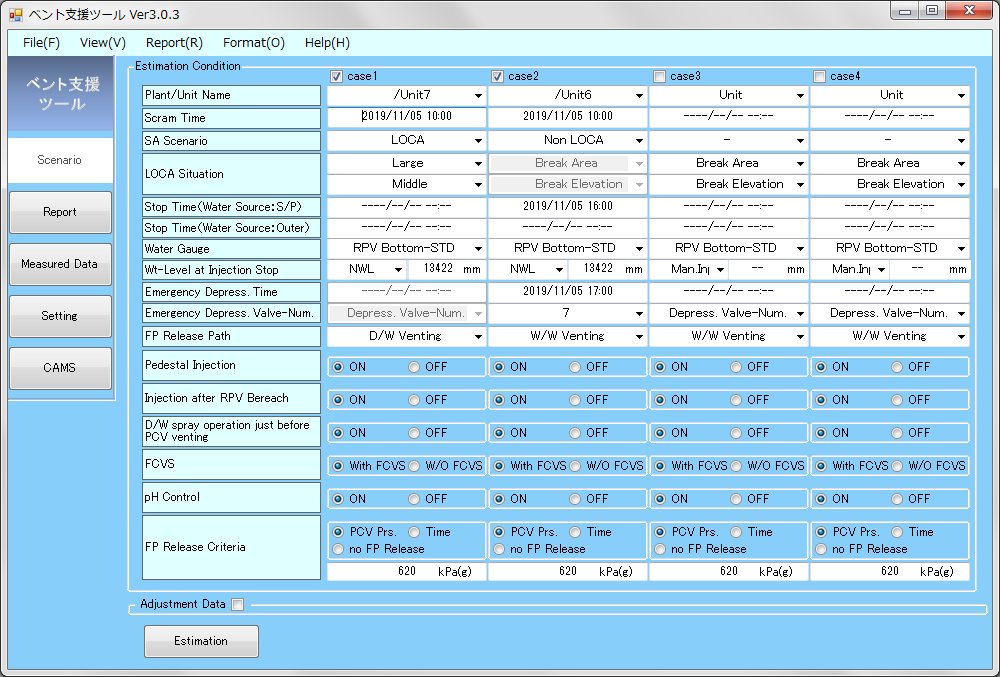
Fig. 2 Screen shot of scenario input window (Multi-unit mode)
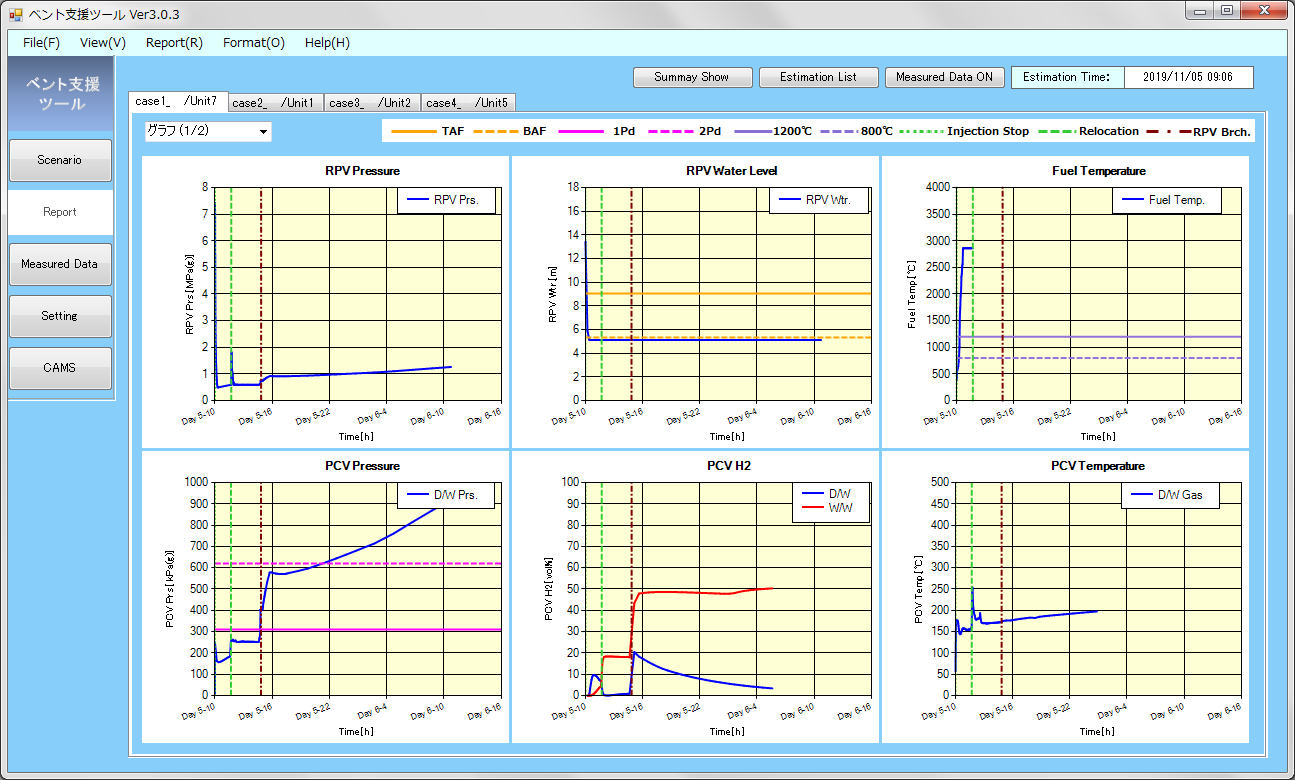
Fig. 3 Screen shot of report window
The tool outputs “summary prediction table” and “PDF format report” are shown in Fig. 4 and Fig. 5. The summary table provides TSC personnel very essential information about the PCV vent timing and radioactive material release, and latter detail and formal report can be provided other stakeholders as bulletin. The report includes prediction results and graphs, can be generated automatically with only setting in “report setting window” as shown in Fig. 6.
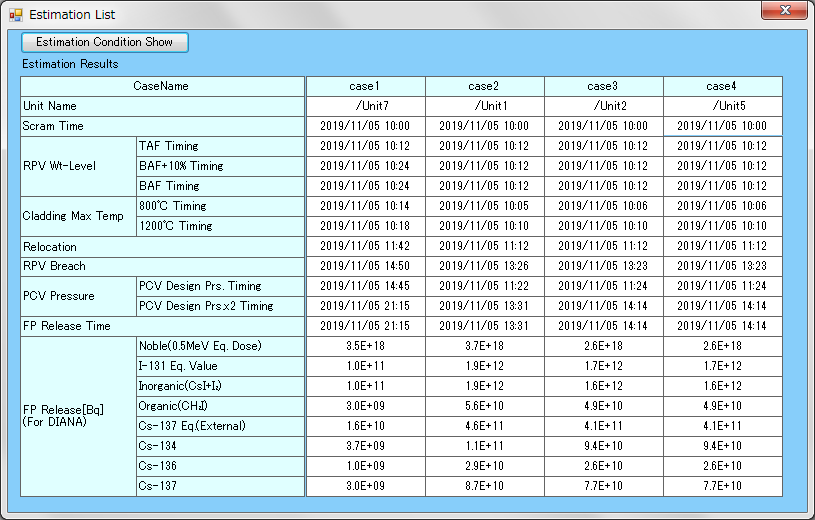
Fig. 4 Screen shot of summary window
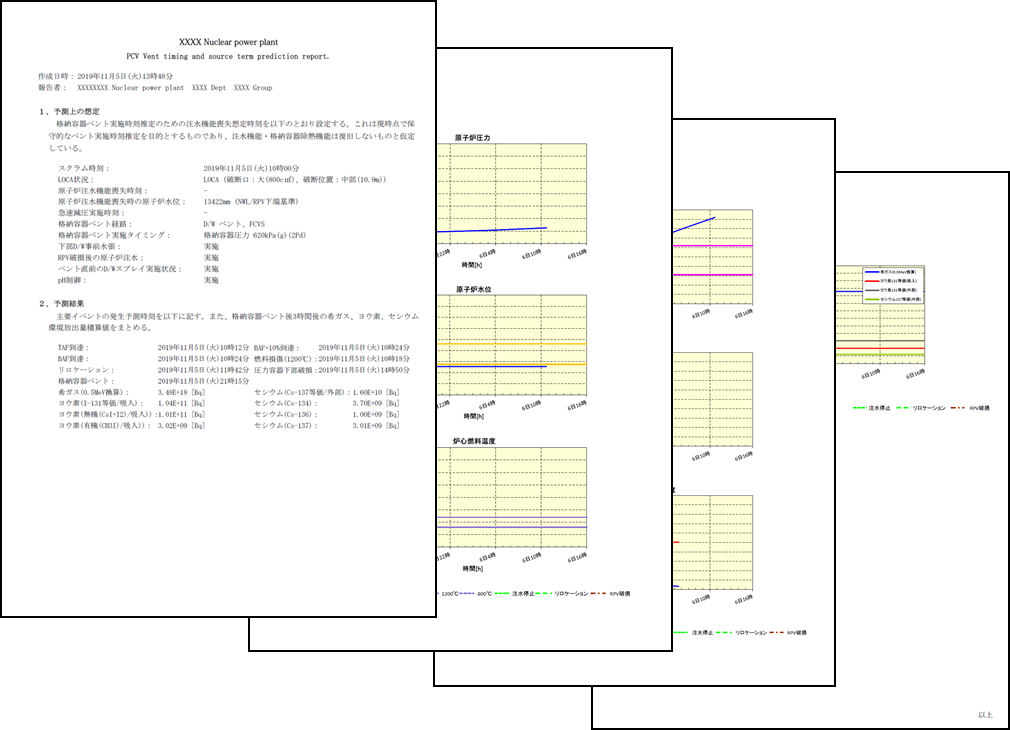
Fig. 5 Example of auto generated report
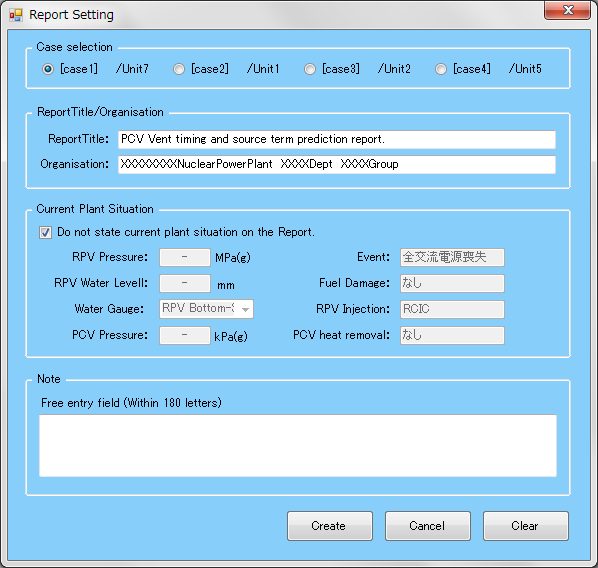
Fig. 6 Screen shot of report setting window
The additional feature of this tool is to estimate on-site radiation dose contour map using estimated radioactive release rate as shown in Fig. 7. This window provides inhalation, grand shine, cloud shine, and sky shine radiation dose for each point related to important accident management activities, for example fire pump joint of reactor building, generator car connecting point, and water tank supply point. The dose map is utilized to understand the integrated radioactive dose during the anticipated operation. Users are expected to input operation term (start and end timing of on-site operation), wind speed, and atmospheric stability index. The sky shine dose rate is estimated using G33 code pre-calculated data base assuming only FCVS iodine filter is dominate radiation source for this exposure pathway. For the other exposure pathway, Gaussian plume model is applied to estimate dose rate conservatively assuming that wind is directly blowing into each point in the map.
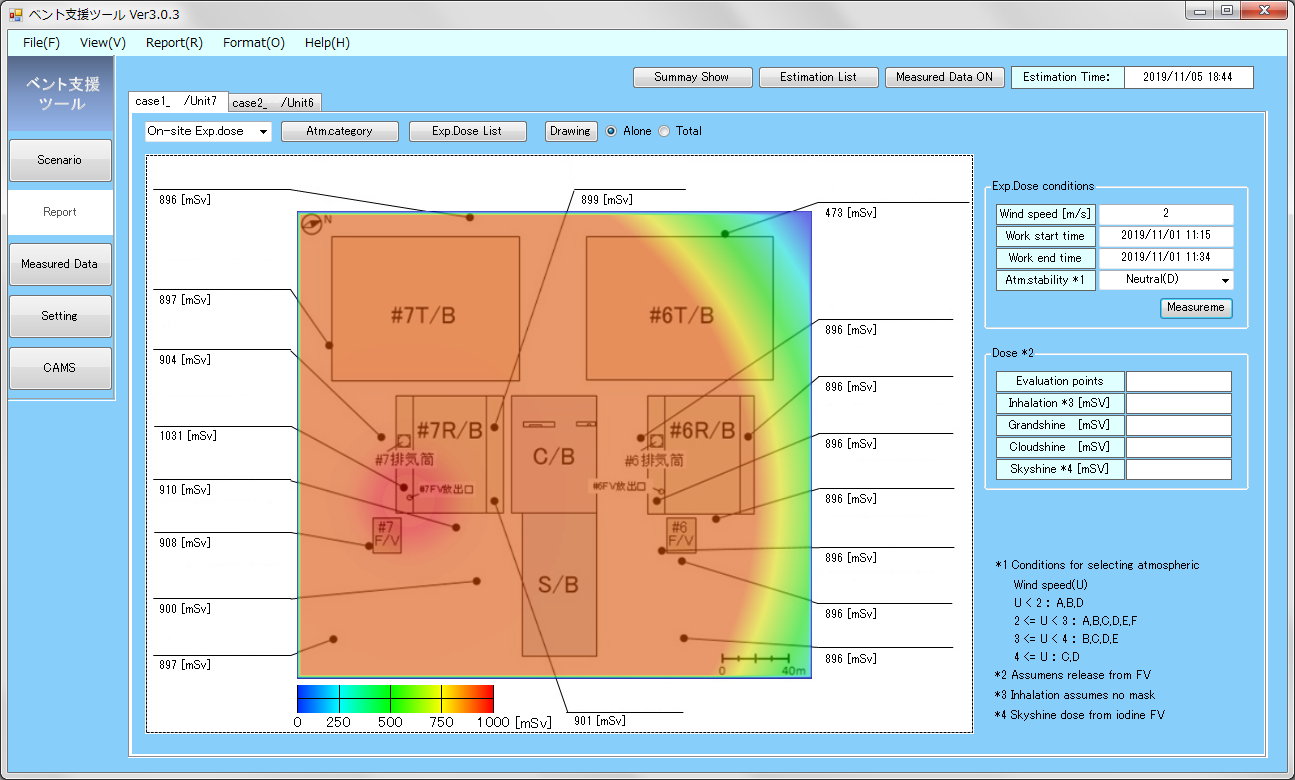
Fig. 7 Screen shot of on-site radiation dose window
2. Development Phase
3. Scope
- (1) Components:
Works on Windows 7, 8, 10
- (2) Location:
N/A
- (3) Materials:
N/A
- (4) Condition:
Target Nuclear Plant Type: BWR (MARK-II, ABWR)
Target Severe Accident Scenario: LOCA, TQUV, TQUX, TW, TB
4. Features
The remarkable advantages of this tool compared to the conventional severe accident analysis code such as MAAP are easy handling and fast running features. As for easy handling, this tool minimizes requisite input conditions and most of user actions are pushing buttons. As for the fast running feature, this tool doesn’t calculate each parameter trend directly, but build up each parameter based on large database composed with hundreds of MAAP calculation results. Therefore, the calculation time is almost instant. Each calculated MAAP parameter trends are cut and divided to fragment trends for each four characteristic accident terms as follows,
- Water injection (into RPV) term
- Water level reduction term (From injection stop timing to before debris relocation into RPV lower head)
- RPV breach term (From debris relocation into RPV lower head to RPV breach)
- MCCI term (After RPV breach)
Hundreds of MAAP accident scenarios consist with combination matrix of water injection, water source, RPV depressurization, PCV spray, pedestal flooding/Injection, and LOCA conditions.
The tool will re-construct each parameter trends based on the user specified accident conditions. This re-construction process takes just a moment and only radioactive decay calculation is carried out in this tool to estimate the amount of radioactive material release. The validity of the predicted each trend is confirmed comparing with MAAP direct calculation. This scheme for fast running severe accident prediction is currently applying for a patent.
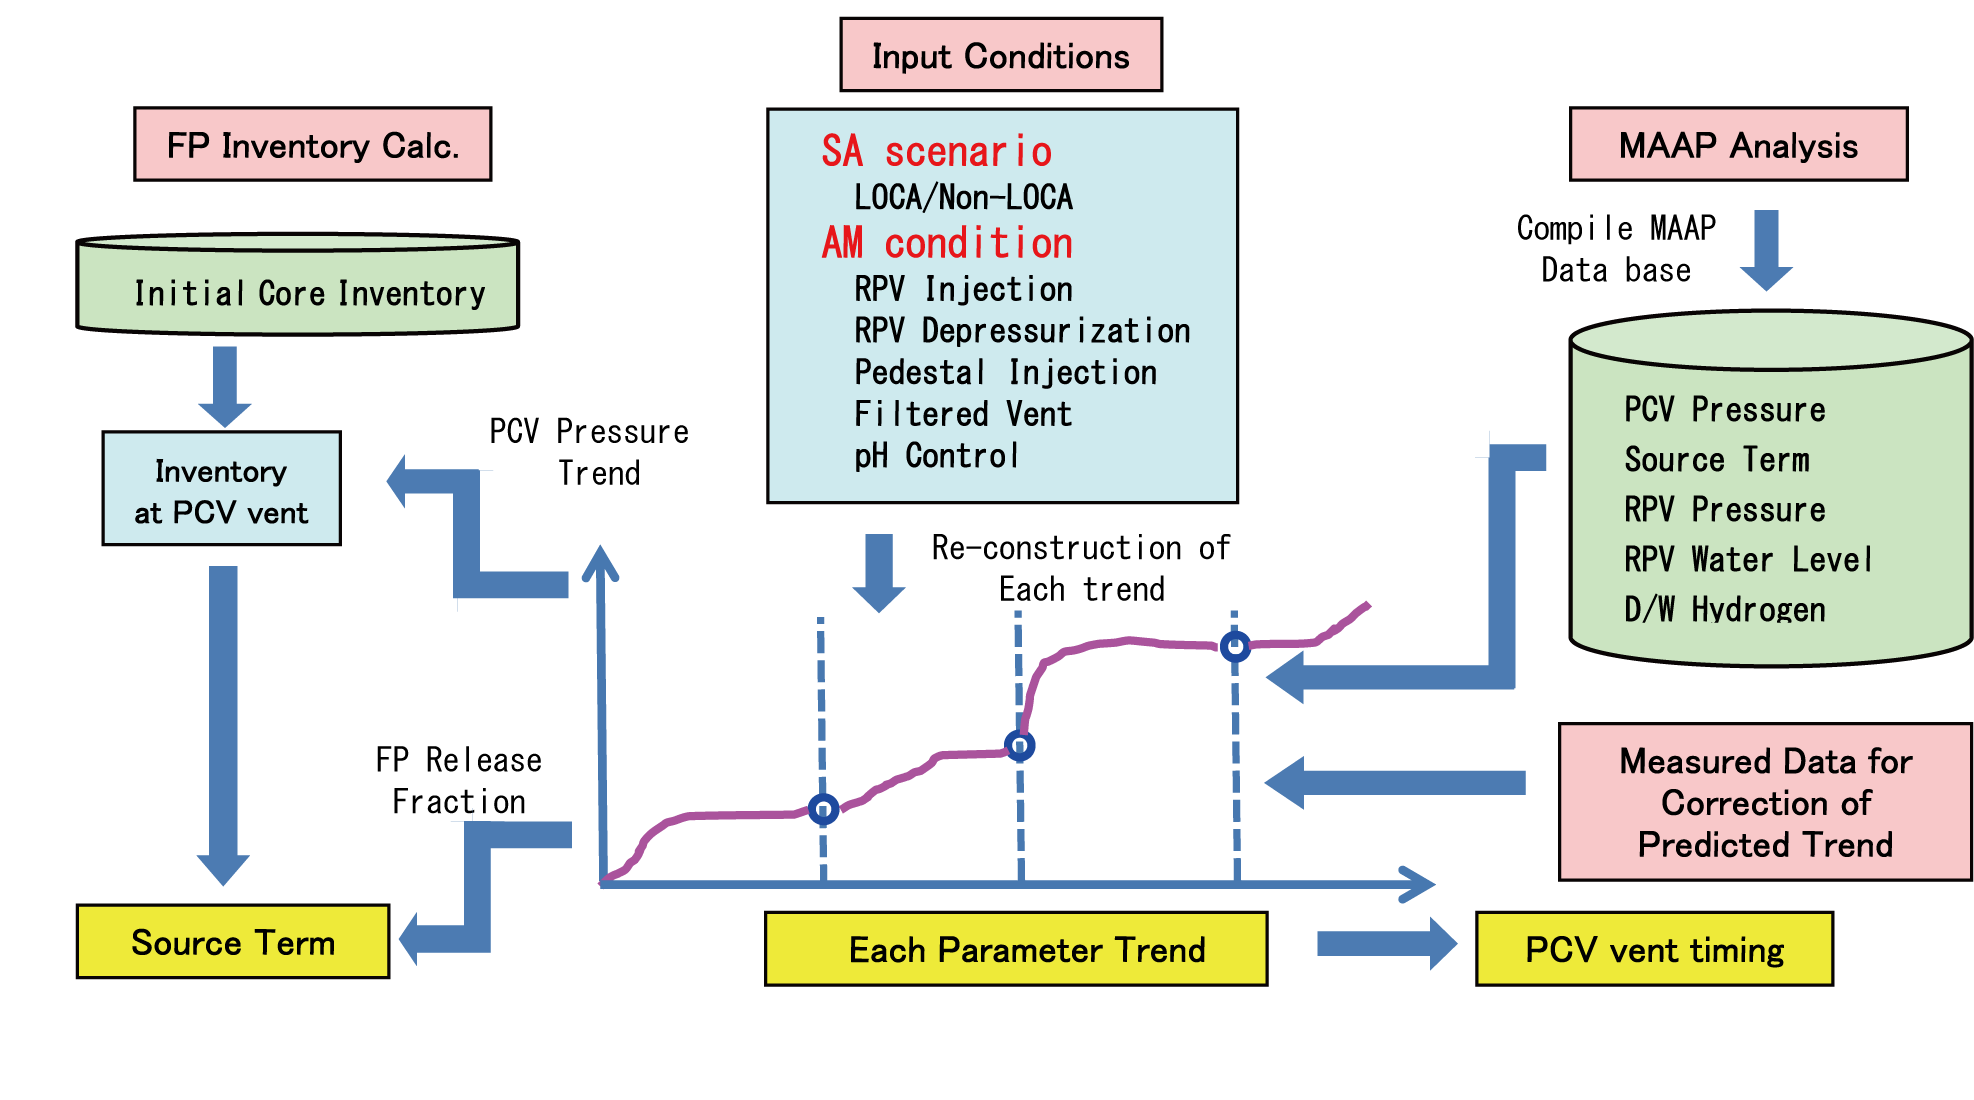
Fig. 8 Schematics of system structure
Next feature for the better prediction is related to overlay plotting function of predicted and measured PCV pressure trend as shown in Fig. 9. Users can input measured trend in this tool, then we can see the difference between predicted and measured PCV pressure. The accuracy of PCV pressure prediction affect directly the accuracy of PCV vent timing, so this tool provide correction function based on user input bias for PCV pressure. User can input PCV pressure bias on “scenario input window” to overlap the predicted and measured PCV pressure trend.
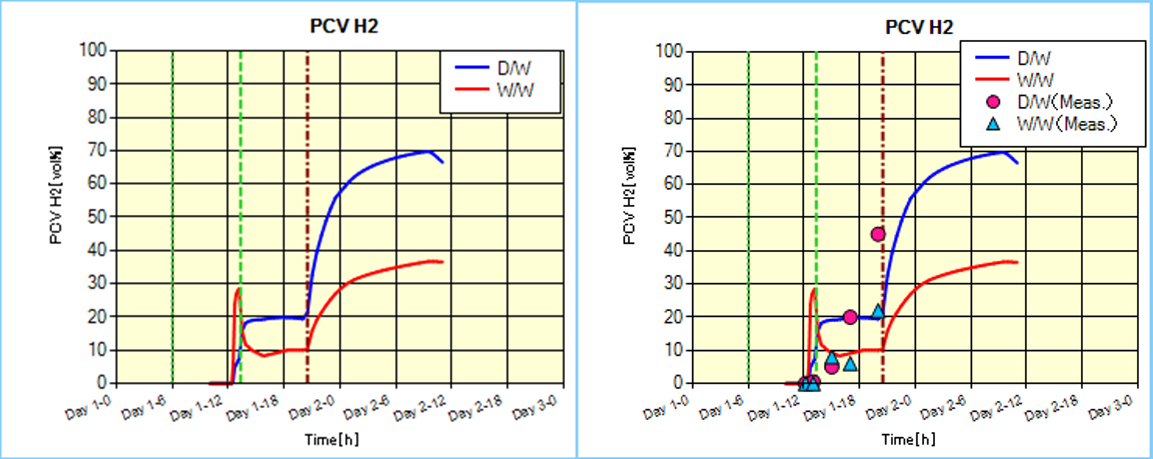
Fig. 9 Overlay plotting of predicted trend and measured trend
(Left Fig.: predicted trend, Right Fig,: over laid graph with measured data)
Last feature is user support function to decide LOCA break area and its elevation. It is quite difficult to estimate those LOCA input condition because those information are not measured directly in actual NPP. For this issue, this tool focuses on the PCV pressure trend which indirectly reflects the LOCA-break-area and its elevation. The tool provides overlay plotting of the “measured PCV pressure trend” and “several database PCV pressure trends” as shown in Fig. 10. If measured PCV pressure looks similar trend with one of the database PCV pressure, then user can judge the current LOCA condition will close to that of database PCV pressure trend.
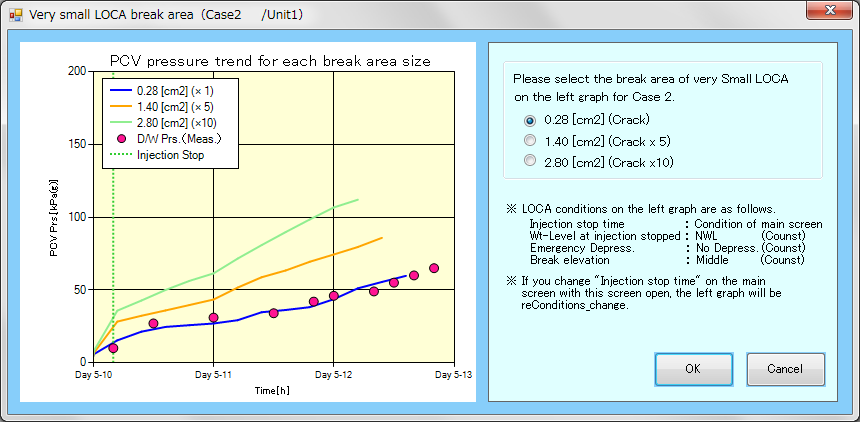
Fig.10 LOCA break size and elevation setting window
5. Example of Application
The tool has been applied to TSC activity at Kashiwazaki-Kariwa NPP emergency training. This kind of computer aid utilization was identified as “Good Practice” by IAEA OSART in 2015[6]. The emergency trainings are held more than ten times a year and continuous improvements have been carried out reflecting users’ feedback. The application of this tool enables TSC personnel to predict coming PCV vent timing, amount of radioactive material release quite effectively, for several possible event tree. This activity is one of the continuous efforts to enhance emergency preparedness of NPP.
6. Reference
- 1. Hidetaka Imai et. al., “Development of tool for containment vent timing prediction using MAAP database. (1) Conceptual design of tool”, AESJ, proceeding of 2016 autumn meeting (in Japanese)
- 2. Daisuke Fujiwara et. al., “Development of tool for containment vent timing prediction using MAAP database. (2) Verification & Validation of tool”, AESJ, proceeding of 2016 autumn meeting (in Japanese)
- 3. Takumi Noujyu et. al., “Development of tool for containment vent timing prediction using MAAP database. (3) Development of on-site radiation dose map”, AESJ, proceeding of 2019 autumn meeting (in Japanese)
- 4. “MAAP5, Modular Accident Analysis Program for LWR Power Plants, MAAP5 Code Revision MAAP 5.0.1”, November 2011, Report Number FAI/11-1161, Electric Power Research Institute
- 5. “DIANA: Dispersion analysis system for off-site dose analysis under severe accident in BWR” (in Japanese)
- 6. “Draft Technical Notes of the Operational Safety Review Team (OSART) Mssion to the Unit 6 and 7 of the Kashiwazaki-Kariwa Nuclear Power plant Japan”, IAEA, 2015
7. Contact
Japan Society of Maintenology (ejam@jsm.or.jp)